Fishbone diagrams may also be referred to as “Cause and Effect” diagrams, or Ishikawa diagrams, after their founder Kaoru Ishikawa. Whatever your preferred term, the fishbone diagram is a great tool for delving into a problem when we need to determine the root cause, and you are surrounded by the opinions of those around you. It provides a process to clearly define the “Effect” and then puts you to thinking about the possible causes, based on the categories of common problems in manufacturing.

Defining your “Effect”
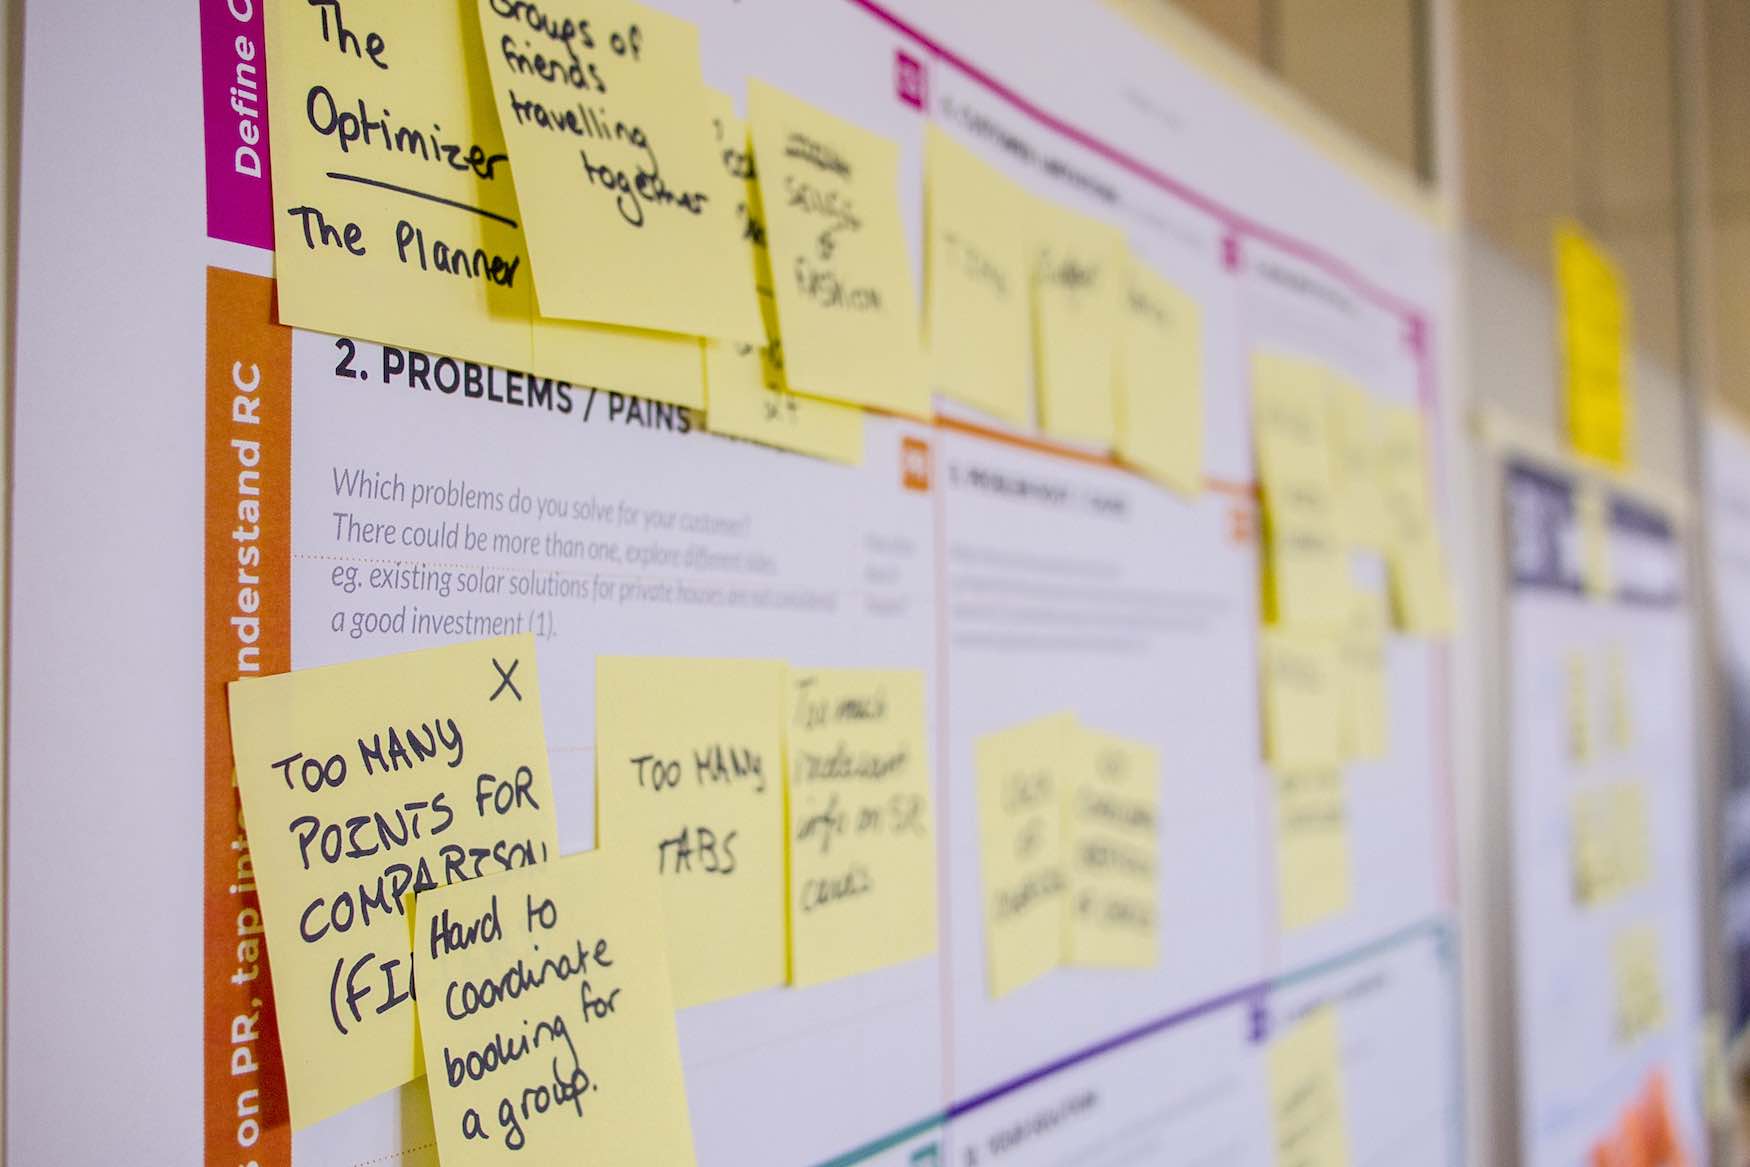
The first step in using the fishbone diagram as a problem-solving tool is to clearly define your effect or outcome that you don’t like. This could be a quality issue, not meeting metrics or troubleshooting the introduction of a new process or product line. This becomes the “head” of the diagram. Use butchers paper or a whiteboard to sketch out out the fishbones template.
Defining an effect takes a little practice. Make sure it is brief and succinct. Use facts and numbers where possible. Spend a few minutes reflecting on your effect with the team; does everyone agree that the statement defines the problem as fully as possible?
Brainstorming the “Causes”
With your team, we want to add the bones to this diagram, brainstorming all of the possible influencing factors. Each idea needs to be put into a category or branch.
In manufacturing, it is accepted that there are 6 main branches that need investigation. These are often described as the “6M’s” but feel free to use the terms that best suit your company.
- People / Manpower: Everyone involved with the process across the value stream, including support functions
- Processes / Methods: This defines how the process is performed and the all requirements needed for doing it, including quality procedures, work orders / travellers / work instructions, drawings.
- Machines / Equipment: All machines and equipment, needed to accomplish the job, including tools
- Materials: Raw materials, purchased parts and subassemblies that feed into the end product
- Measurements: defines how have we determined that the outcome is wrong
- Environment: The conditions that influence the process including time, temperature, humidity or cleanliness

As the team suggests possible causes, determine which heading that idea belongs under, jotting it down clearly. Also add another branch, covering “why” that cause would influence the effect we are investigating. Continue until the team runs out of ideas.
If you find there are branches of the diagram that are missing, delve into that area further, asking questions; “Is it possible that the environment has affected our problem” too hot, too cold, too wet?

When you are out of ideas, take a break to clear everyone’s head. Here we change modes and needs a little time for our brains to shift gears. Now we don’t need any new ideas, we need to determine the top 2 or 3 possible causes that can be resolved and will have the most impact of the effect. You can use an A3 plan to outline the current state, future state and the steps needed to achieve it.
If the top few causes are not clear, determine what further information is needed. While using a fishbone diagram does take time to develop, it will help you and your team to determine the real causes and allow you to improve your process and implement lasting change.
Related Content
- Lean Problem Solving articles
- Purchase Lean Products including Problem Solving Concern Strips from our E-Store
- The process of problem solving

Continuous improvement is at the heart of what we do at TXM. We have a proven track record of helping our customers achieve sustained superior operational performance. One of the tools we use to help our clients achieve this is the fishbone diagram. Also known as a Cause and Effect Diagram, the Fishbone Diagram is a valuable tool for identifying the root causes of problems. By identifying and addressing the root causes of problems, our clients are able to achieve significant improvements in their operations. If you are facing operational challenges, we encourage you to contact us to learn more about how we can help you using fishbone diagrams and other Lean tools. Continuous improvement is essential for achieving Operational Excellence, and TXM is here to help you every step of the way.