Visual Management Boards have become almost ubiquitous in the industry. Almost every factory or warehouse I visit will proudly display its factory performance on a whiteboard or visual display at a prominent point in the workplace. Most companies have grasped the basics, namely the need to keep information current and the benefits of displaying a “balanced scorecard” across a range of performance areas.
However, in most cases I see these boards add little to the business performance. In some cases they can be actually harmful, intimidating staff worried about substandard performance and eroding management credibility. We know that communicating business performance to staff through visual management boards can and does help employee engagement and drive daily improvement in many businesses.
So what are the secrets to success to visual management? Here are five simple tips from our experience to help you avoid the pitfalls and get the best out of Visual Management Boards
Five Tips to Designing an Effective Team Visual Management Board
1. The Board Belongs to the Team
As a manager, you may have a burning desire to create our own vision of an information centre or visual management board in the middle of your factory or workplace. It is important to resist the temptation. However,
the goal of visual management boards is for front line teams to understand operational performance and engage in improvement.
Therefore your role as a manager is to coach your teams to understand their performance and measure it themselves. This starts with a conversation about “what does a good day look like”? Ask the team how they measure performance. They may have simple indicators such as numbers of jobs completed or boxes packed, which make sense to them.
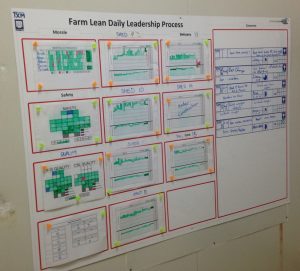
A simple throughput measure like this is usually the start. You may only initially track one metric and then expand this to include metrics in safety and quality. Keep the number of metrics low – ideally three or four, but no more than six or eight.
The board also should not only be a collection of graphs but instead should show problem-solving activities aimed at improving the performance and list current issues that the team is working on. It is a communication board for the team, not just a place to record data on performance.

TXM Article: Read the Truth about Visual Management Boards
2. Make a Topic of Conversation – Not Wallpaper
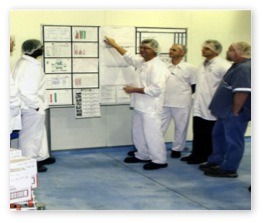
If you think just putting information on a Visual Management Board on the wall will get people to engage, then you will be disappointed. I see many big immaculate visual displays sprawling across entrance halls and walkways with literally dozens of metrics displayed. Here is the bad news: no one looks at them. In many cases, the job of printing the graphs and posting them is delegated to an administrative staff member and not even the business leaders notice or read the graphs.
We call this type of visual management board “wallpaper” because that is the only function they serve. The boards need to be the focus of structured daily conversations about how the team is going, what are the barriers to improvement and how these barriers can be overcome. Therefore visual management boards go hand in hand with daily meetings. We tend to also link this to leaders standard work in our Lean Daily Leadership Process(r)
TXM Lean Minute: Learn about Visual Management Boards
3. Boards Need to be Accessible and Close to the Workplace
The purpose of visual management boards is to be a reference point for discussions around team performance. Therefore the boards need to be located near where the teams work. That means in a safe location (not a forklift aisle) in the workplace where noise is sufficiently low to allow a conversation and where the board will not be obstructed by materials or machinery.
People stand up during their daily meetings, so there needs to be sufficient space to enable the team to meet in front of the board. Lighting also needs to be good enough to read what is on the board.
4. Visual Management Boards Don’t Have to Look Beautiful
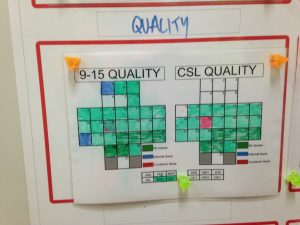
One of our greatest frustrations with implementing visual management boards is managers’ preoccupation with aesthetics – how the board looks. We strongly advocate for handwritten graphs and problem-solving strips because this shows that it is the team itself that is updating the data. Using the “green pen = on target, red pen = off-target” approach really communicates strongly to the team how they are going. The team leader has to pick up the red pen to record off-target performance.
This is a very conscious act and makes the Team Leader and the team very aware of the problem performance area. It then inevitably prompts a problem-solving discussion about how to turn the red line into a green one. Computer printed graphs and computer “dashboard” screens in the workplace are by definition developed by someone working on a computer. That person is usually a manager or staff member who works in an office and is not part of the team. The act of preparing, printing and posting the graphs lacks the immediacy and impact of handwriting the result using the red or green pen.
The computer dashboard approach reduces engagement further because now the data is being fed to the team by a computer and the team are the passive recipients of this information. Computerized production rate clocks or graphs can be useful to maintain a constant takt time during the day, but having a daily team meeting around a computer screen is unlikely to generate much engagement.
TXM Article: Learn How to Create a Visual Management Board of Your Own
5. Don’t Kill Ownership with Standardisation
Another obsession of some managers is “standardising” the appearance of the boards. Again the drive behind this is aesthetics rather than employee engagement. The boards are located in different work areas and managed by teams who perform different functions and therefore the boards SHOULD look different. They should reflect on the particular priorities and issues of each team. You can have some common themes such as requiring each team to record metrics for safety, quality, performance, and morale. You will also expect to see that each board has room for problem-solving (such as TXM’s Solving Problems Every Day(r) concern strips), a team meeting agenda, a meeting attendance chart and perhaps some guidelines for running team meetings. However, expect each team’s board to be a bit different. In fact, if you see boards are becoming strikingly the same, then this might be a warning sign that teams are maintaining the boards because they have been told to, rather than because they see value in the visual management boards and the daily meeting. There are lots of other tips and ideas that you can apply in making an effective team visual management board, but hopefully, these ideas give you a start.
Learn more about lean problem solving

Author: Timothy McLean
Timothy McLean is the Managing Director of TXM Lean Solutions and is an author of Lean books.